 Multi-wavelength observations of sunspots with the 1.6-meter telescope at Big Bear Solar Observatory (BBSO) in California and aboard NASA's IRIS spacecraft have produced new and intriguing images of high- speed plasma flows and eruptions extending from the Sun's surface to the outermost layer of the solar atmosphere, the corona. The 1.6m New Solar Telescope (NST) of Big Bear Solar Observatory allows us to investigate the structure and dynamics of sunspots with unprecedented spatial and temporal resolutions. The results of simultaneous observations of a sunspot in the photosphere with a broad-band TiO-line filter and in the chromospheric H-alpha line with Visible Imaging Spectrometer reveal previously unresolved features of the sunspot umbra and penumbra. In particular, the TiO data clearly demonstrate highly twisted dynamics of penumbral filaments and umbral dots and reveal strong shearing plasma flows in sunspot bridges, not explained by sunspot models. The high-resolution H-alpha spectroscopic data provide new views of the sunspot chromospheric dynamics, including the fine structure of oscillations and waves, penumbral jets, ubiquitous small-scale eruptions, and accretion flows in a form of dense plasma sheets. The diffraction-limited NST observations show that the sunspot dynamics is more complicated and much richer than it is described by the current sunspot models.
The results are presented by Alexander Kosovichev, Vasyl Yurchyshyn and Santiago Vargas Dominguez at the 224th meeting of the American Astronomical Society (AAS), held in Boston, Massachusetts on June 2, 2014. Link to the press-release materials.
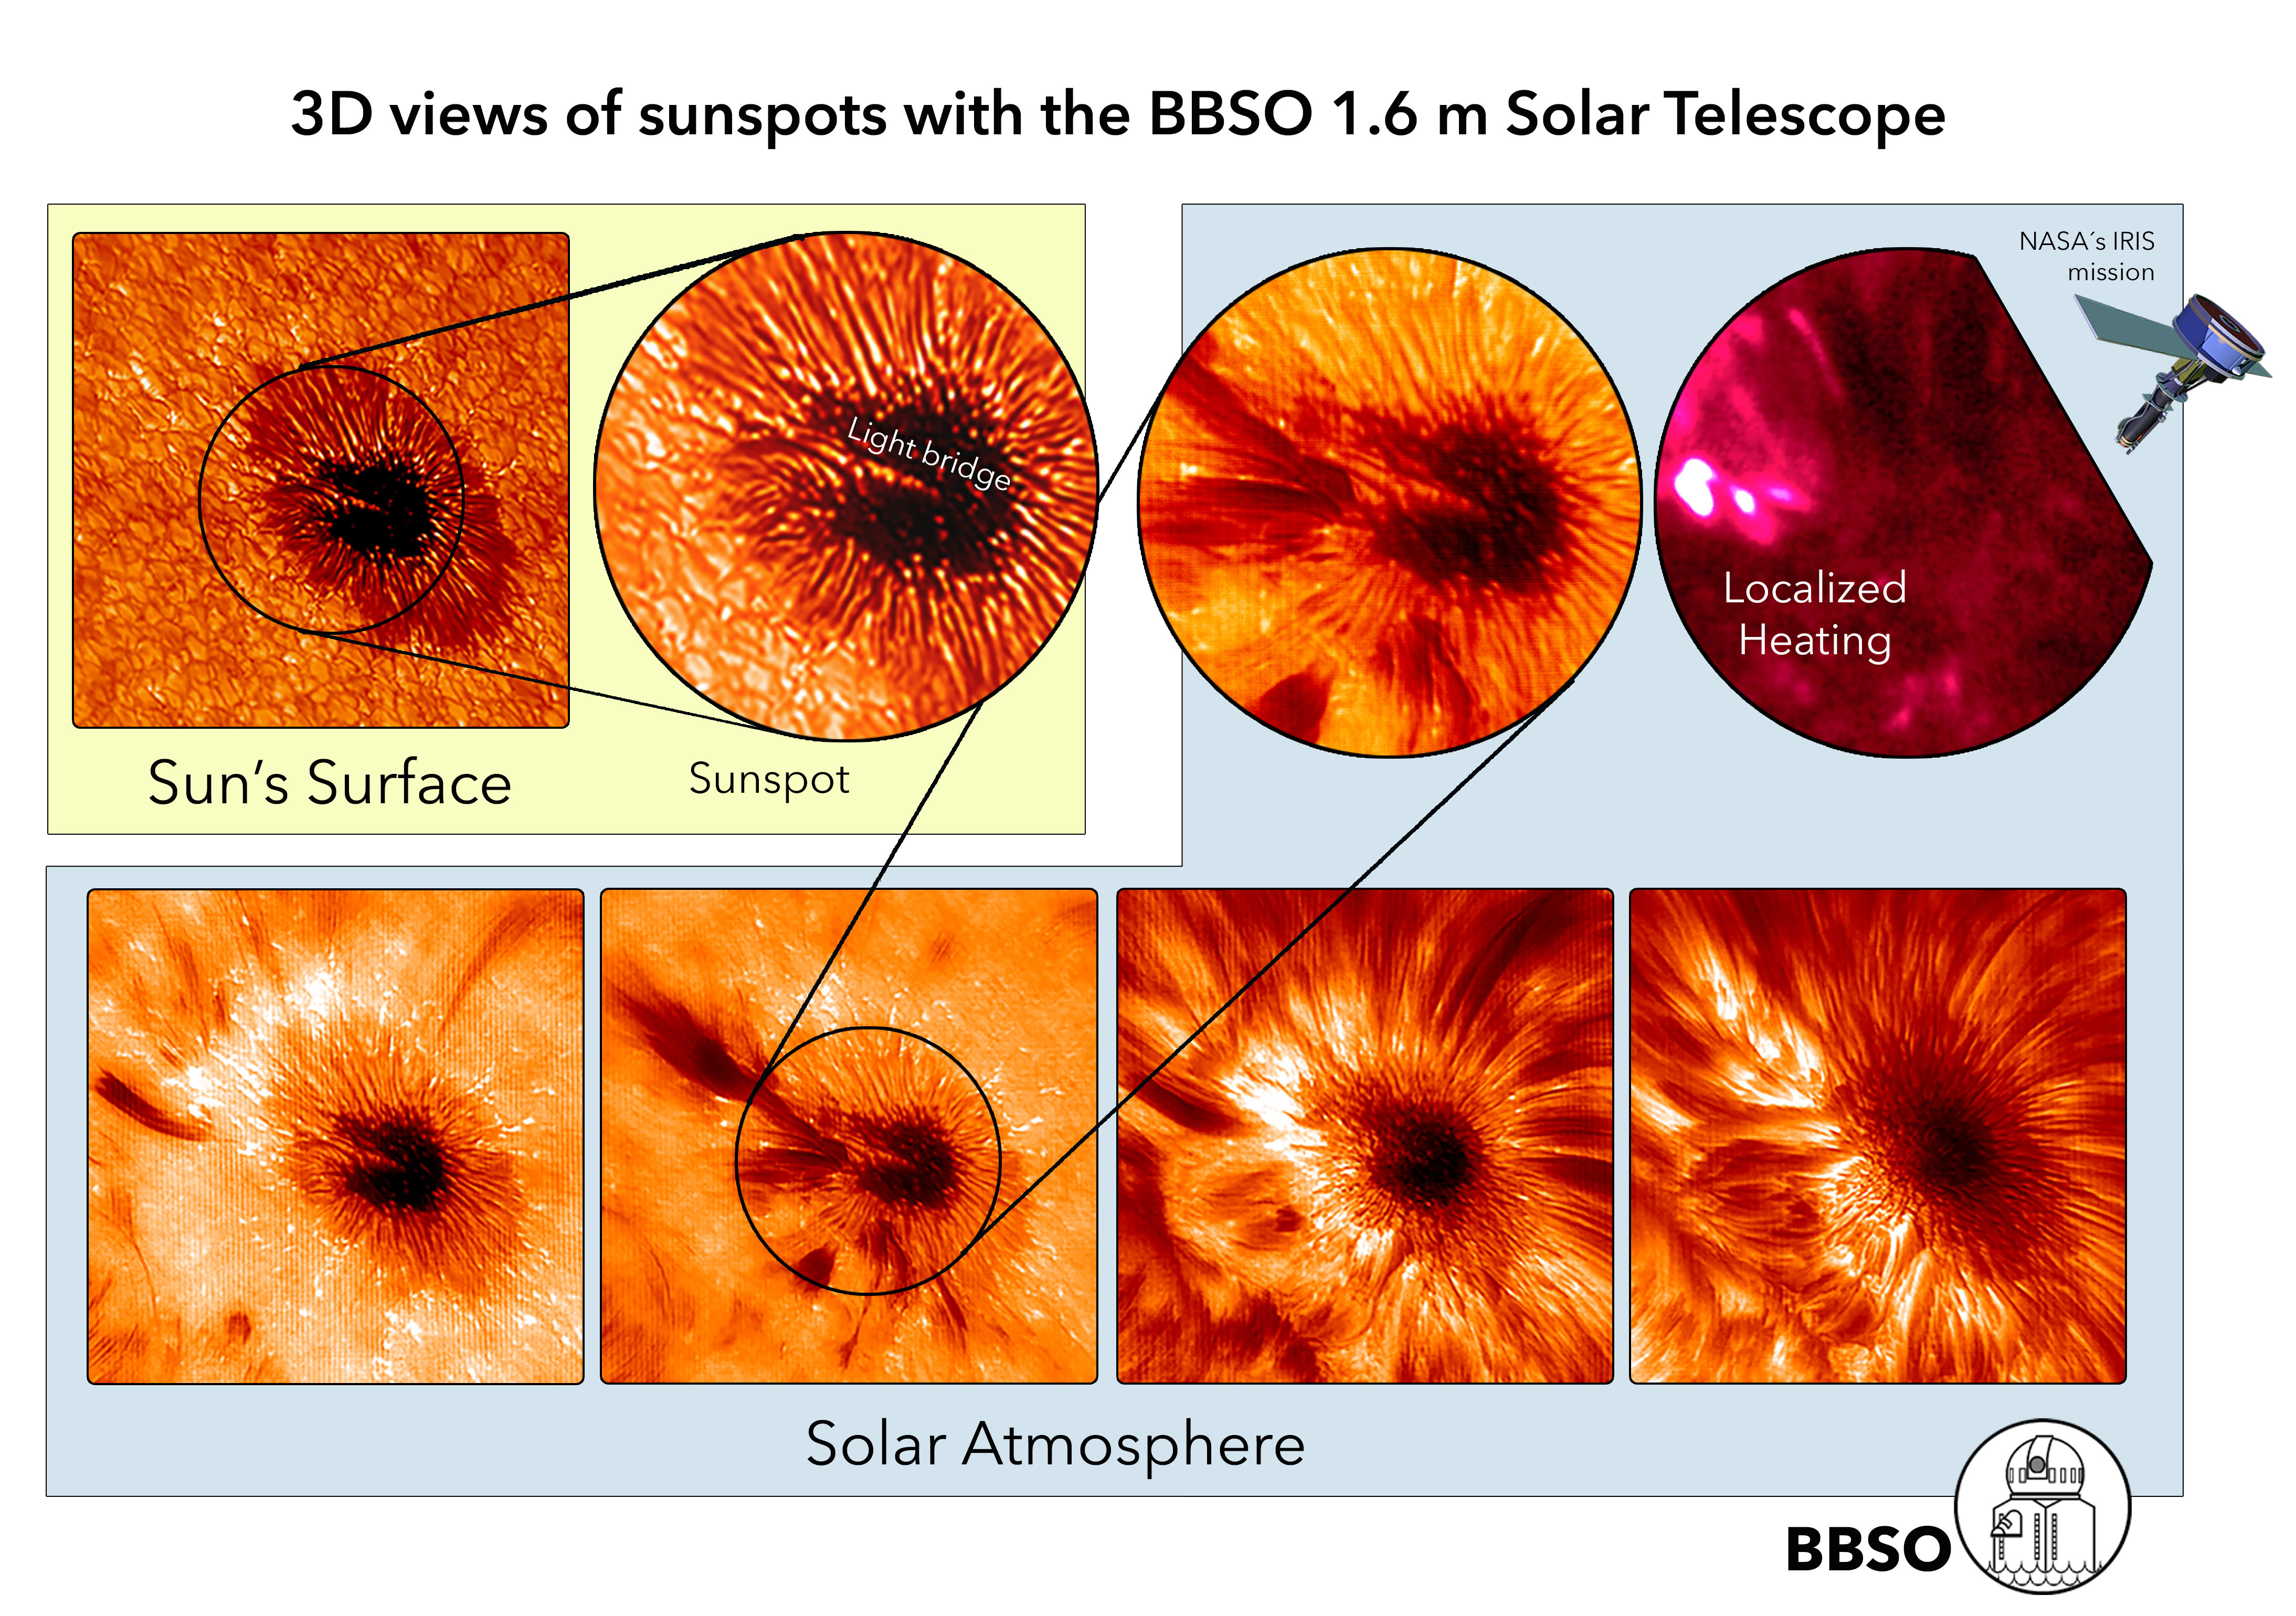
Figure caption. Images of sunspot structure on the solar surface (top left) and at different heights above the surface (bottom row) obtained from the New Solar Telescope at Big Bear Solar Observatory (NJIT) on 29 September, 2013. The surface images show a dark central part (umbra) surrounded by filamentary penumbra, and an intrusion of hot plasma in the umbra ("light bridge"). The atmospheric images reveal fast plasma jets (bottom left), material accretion in the form of dense plasma sheets (second from the left) and very dynamic fibrils (two right panels). The sunspot activity is exceptionally strong in the "light bridge" area, above which the IRIS satellite detected sharply enhanced UV radiation (top right image). Image xredit: Santiago Vargas Dominguez & Alexander Kosovichev (BBSO/NJIT).
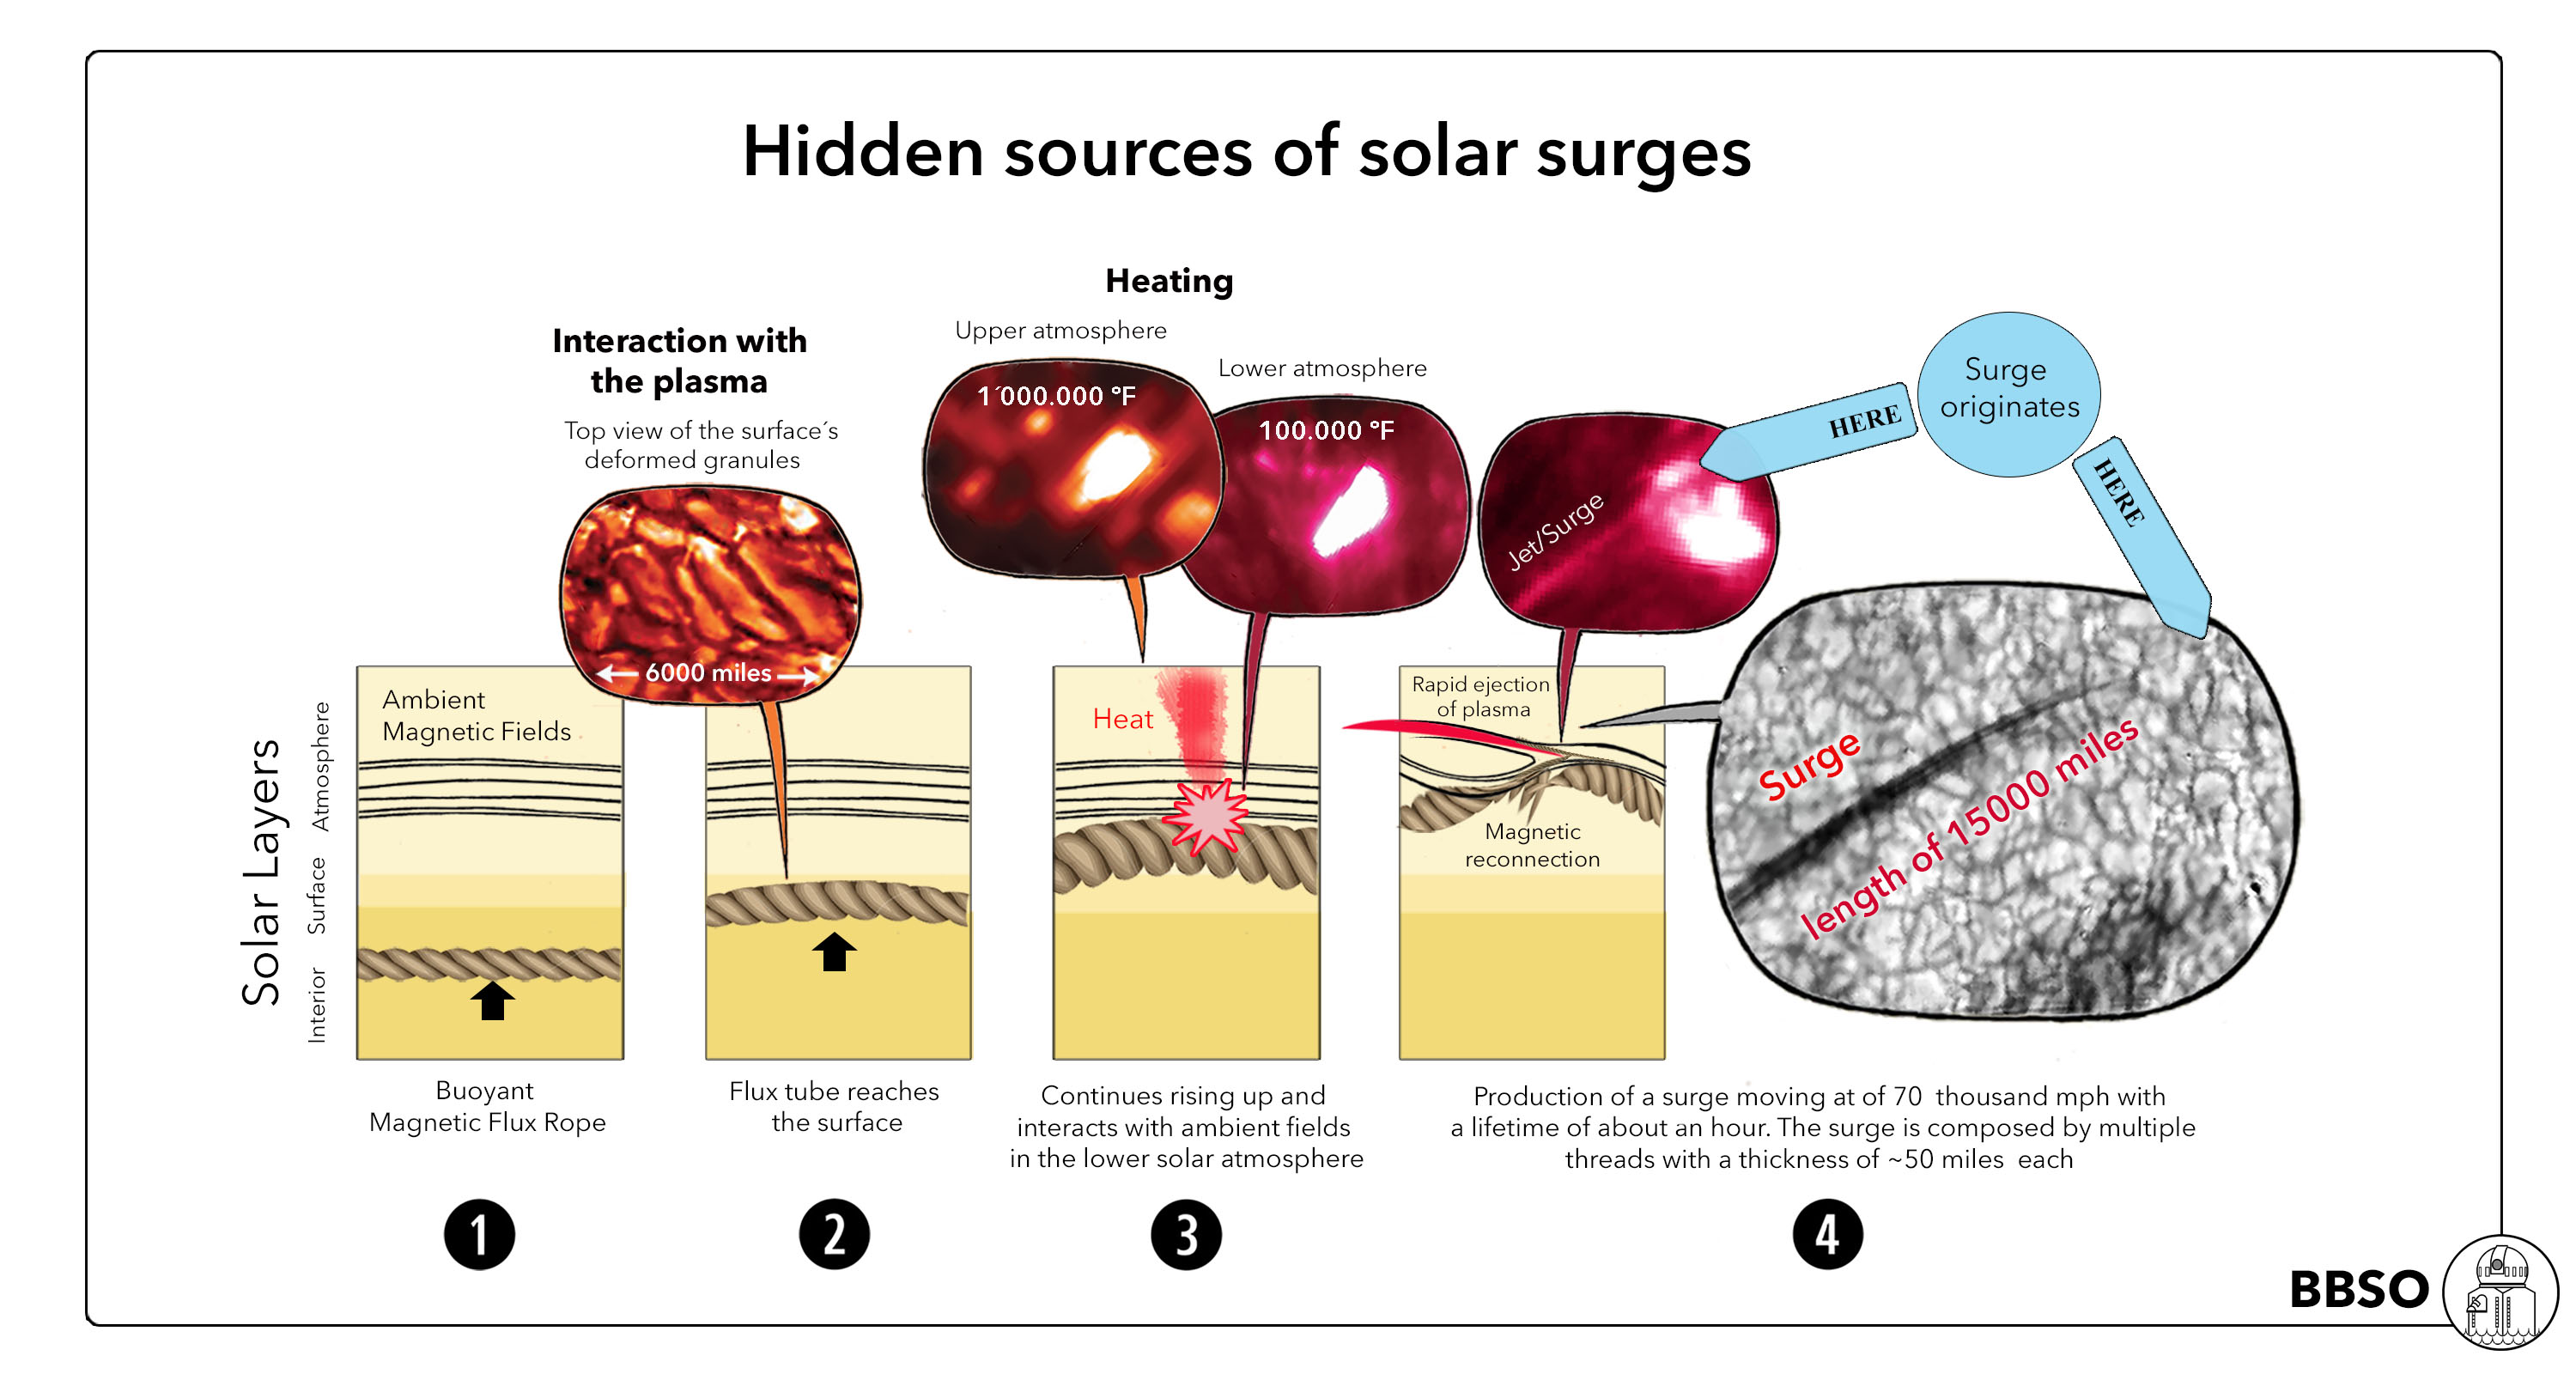 Cutting-edge observations with the 1.6-meter telescope at Big Bear Solar Observatory (BBSO) in California have taken research into the structure and activity of the Sun to new levels of understanding. Operated by New Jersey Institute of Technology (NJIT), the telescope at Big Bear is the most powerful ground-based instrument dedicated to studying the Sun. A group of astronomers led by Dr. Santiago Vargas Dominguez have analyzed the highest- resolution solar observations ever made and reported on the emergence of buoyant "small-scale" magnetic-flux ropes on the solar surface and the initiation of powerful plasma eruptions in the solar atmosphere. The observations were performed as part of a program conducted jointly with NASA's Interface Region Imaging Spectrograph (IRIS) mission, Solar Dynamics Observatory (SDO) and Hinode satellite. These observations provided a unique view of a magnetic-flux rope in the Sun's surface-granulation pattern that was 6,000 miles long, and the interaction between newly emergent and overlying ambient magnetic fields. This research has shown that the complex action of small-scale and "hidden" fields on the Sun is important for understanding how energy is transported to the solar atmosphere. The process investigated can play a significant role in mass and energy flow from the Sun's interior to the corona, the solar wind and Earth's near-space environment. investigated can play a significant role in mass and energy flow from the Sun's interior to the corona, the solar wind and Earth's near-space environment. The results are presented by Santiago Vargas Dominguez, Alexander Kosovichev and Vasyl Yurchyshyn at the 224th meeting of the American Astronomical Society (AAS), held in Boston, Massachusetts on June 2, 2014. Link to the press-release materials.Figure caption. Cartoon illustrating the action of a six-thousand miles long magnetic flux rope rising up from the solar interior and stretching the granules. The interaction between the emerged and the ambient magnetic fields produces impulsive heating and an ejection of a plasma surge. Image credit: Santiago Vargas Dominguez (BBSO/NJIT)
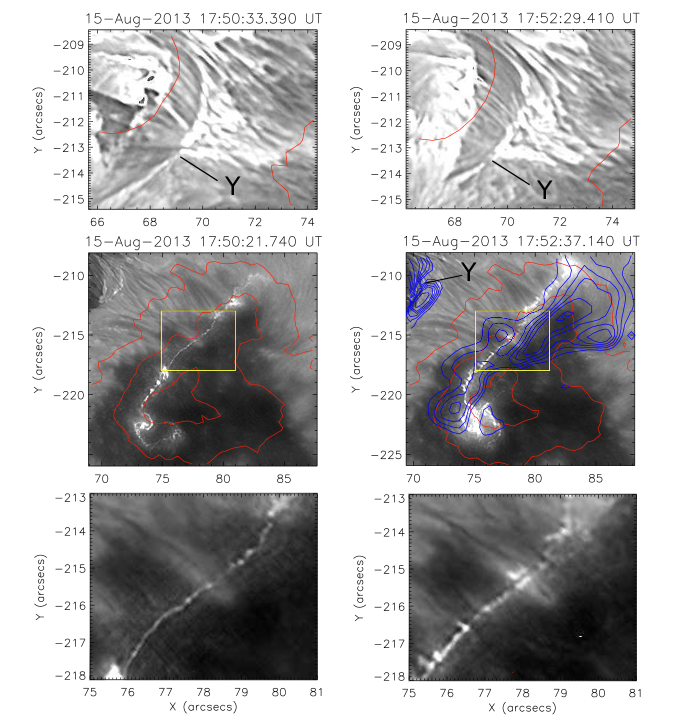 Emission of solar flares across the electromagnetic spectrum is often observed in the form of two expanding ribbons. The standard flare model explains the flare ribbons as footpoints of magnetic arcades, emitting due to interaction of energetic particles with the chromospheric plasma. However, the physics of this interaction and properties of the accelerated particles are still unknown. The results present multiwavelength observations of C2.1 flare of August 15, 2013, obtained with New Solar Telescope (NST) of Big Bear Solar Observatory, Solar Dynamics Observatory (SDO), GOES and FERMI spacecraft. The observations reveal previously unresolved sub-arcsecond structure of the flare ribbons in regions of strong magnetic field consisting from numerous small-scale bright knots. The NST/VIS Halpha data (left) reveal superfine structuring of the chromospheric flare emission with a characteristic size of about 100 km, organized in a very thin but long, approx. 10,000 km ribbon crossing the sunspot region. The other flare ribbon, located in a flare region, is spatially diffused but also displays small-scale structuring. In addition, the chromospheric emission of the flare ribbons starts long before the HXR impulse. The observed heating before the appearance of hard X-ray emission cannot be explained by accelerated particles precipitating into the chromosphere, as assumed by the standard model of solar flares. There must be additional heating mechanisms associated with the superfine organized structuring of the flare ribbons. Such fine structuring suggests that the heating mechanism may be related to Joule heating by chromospheric electric currents. One of the most important open issues of this research is a very regular thread-like organization of the superfine structuring of the observed ribbons. This large-scale organization of the initial energy release needs further observational studies coupled with theoretical modeling.Original paper titled "Fine Structure of Flare Ribbons and Evolution of Electric Currents" by I. N. Sharykin and A. G. Kosovichev was published in June 10 2014 issue of Astrophysical Journal Letters. ( ADS/ArXiv)
 | Recent observations of sunspot's umbra performed with the NST show that the sunspot's umbra is finely structured at a sub-arcsecond scale representing a mix of hot and cool plasma elements. Images and moviesfrom NST's Visible Imaging Spectrometer reveal cool jet-like structures seen in the chromosphere of an umbra. The spikes are cone-shaped features with a typical height of 0.5-1.0Mm and a width of about 0.1Mm. Their life time ranges from 2 to 3 min and they tend to re-appear at the same location. The spikes are not associated with photospheric umbral dots and they rather tend to occur above darkest parts of the umbra, where magnetic fields are strongest. The spikes exhibit up and down oscillatory motions and their spectral evolution suggests that they might be driven by upward propagating shocks generated by photospheric oscillations. It is worth noting that triggering of the running penumbral waves seems to occur during the interval when the spikes reach their maximum height. |
 New observations of the solar granulation with the New Solar Telescope (NST) at the Big Bear Solar Observatory (BBSO) allowed a NJIT-Stanford research team to make the next step in understanding of the solar surface structure. A new complex world of very small granules became visible between normal solar granules. Mini-granules, as small as Maine, form a multi-fractal structure, similar to other systems in nature, such as coast lines, glaciers, earthquakes, stock market, etc. A key property of such systems is their unpredictable, burst-like behavior and jagged, irregular shape. Usually, occurrence of numerous independent random processes lead to the formation of a such system. Studying of such systems is beneficial for understanding both the universe and the social life.
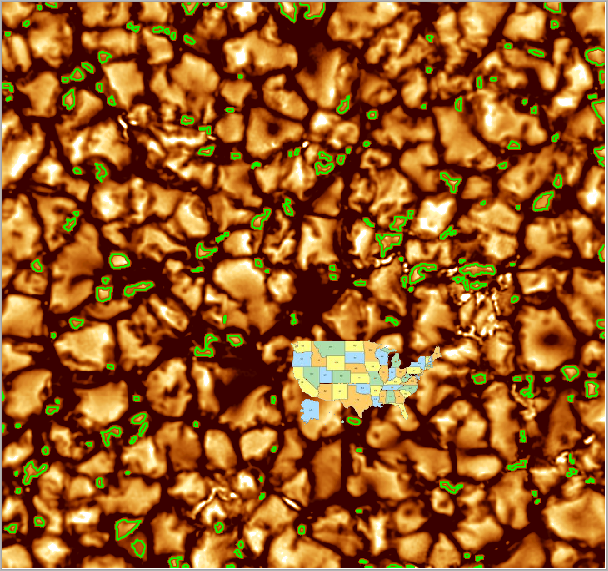
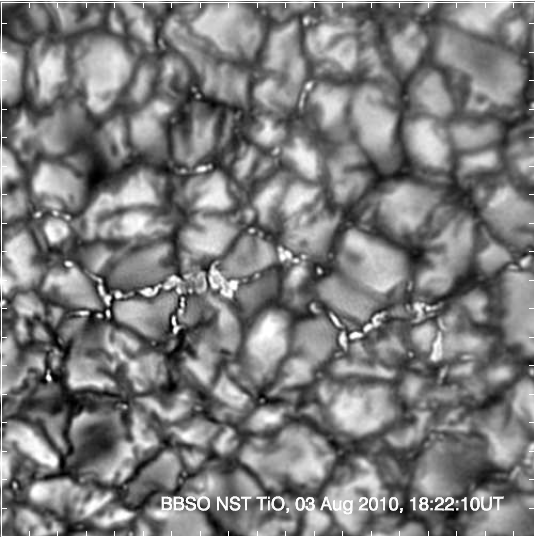
The image shows solar granulation acquired with the NST on August 3, 2010 with overplotted contours of detected mini-granules (structures of equivalent diameter less than 600 km). The image size is 20500x19000 km. A map of USA is overplotted for comparison.
Until now it was thought that solar convection produces convection cells, visible on the solar surface as granules, of characteristic (dominant) spatial scale of about 1000km and a Gaussian (normal) distribution of granule sizes. In this case, the mechanism that produces granules is "programmed" to churn up convection cells of a typical size, without much freedom in size variation. Mini-granules do not display any characteristic ("dominant") scale, their size distribution is continuous and can be described by a decreasing power law (Gaussian distribution does not work any longer here) across all scales ranging from 140 to 2000 km. A majority (about 80%) of mini-granules are smaller than 600 km and about 50% are smaller than 300 km in diameter. This non-Gaussian distribution of sizes implies that a much more sophisticated mechanism, with much more degrees of freedom may be at work, where any very small fluctuation in density, pressure, velocity and magnetic fields may have significant impact and affect the resulting dynamics.
Scientist for long time saw difference in properties of small and large granules. However, low contrast and spatial resolution did not allow scientists to explore the entire range of structures. The NST provides images with contrast twice that of the previous data. It also enables us to see features on the solar surface as small as 80~km. These capabilities allowed us for the first time to accurately detect and measure very small convection cells. Their existence and properties were a subject of debate for long time, and now the NST solves the puzzle of the small (mini) granules.
Original paper titled "Detection of small-scale granular structures in the quiet sun with the New Solar Telescope" by V. I. Abramenko, V.B. Yurchyshyn, P.R. Goode (Big Bear Solar Observatory, NJIT) and I.N. Kitiashvili, A.G. Kosovichev (Stanford University) will be published by Astrophysical Journal Letters at the end of August, 2012
These results were published in Sept 2012 issue of Astrophysical Journal Letters (ADS | Arxiv).
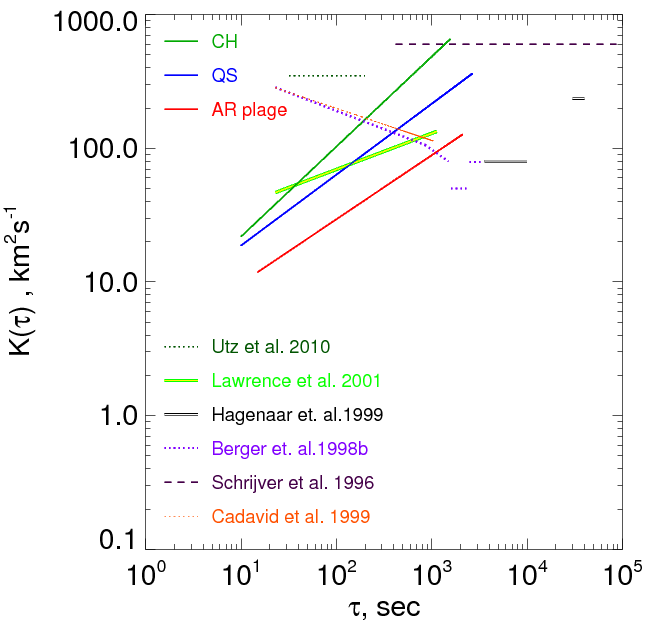
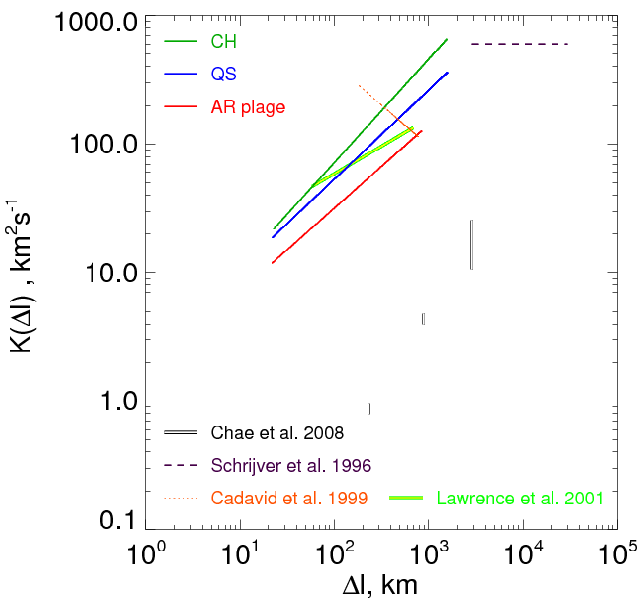
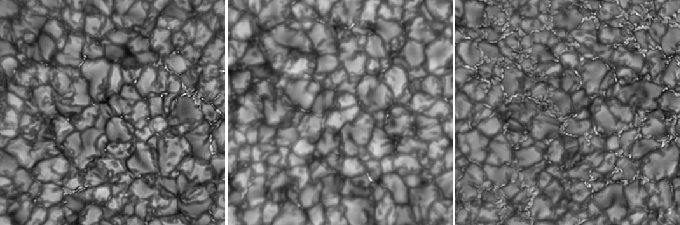 NST data show that solar magnetic fields may disperse over the solar surface in the super-diffusion regime. Super-diffusivity was revealed on small scales (below 600 km) and it opens new possibilities for local turbulent dynamo models. Properties and mechanisms of flux dispersal over the solar surface are important constraints and clues for solar dynamo theories. A spectrum of magnetic diffusivity defined on a broad range of temporal and spatial scales is needed to calibrate diffusivity profiles in models of global solar dynamo. The new finding indicates that the existing paradigm of normal (or sub) magnetic diffusivity needs to be re-considered.We studied proper motion of bright points (BPs) visible in the quiet sun (QS), in a coronal hole (CH), and in an active region plage (ARP, figure above from left to right). By tracking the BPs we were able to measure their displacements as a function of time. (Examples of BP's tracks are shown in the figure below, left, where the blue dots mark the start point). We then calculated the average (over all BPs) displacement for each time interval to obtain the average squared displacement as a function of time (the displacement spectrum, see the blue spectrum in the figure below, right).
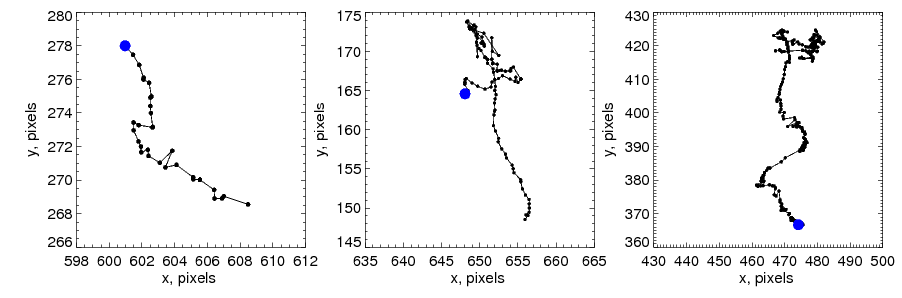 | 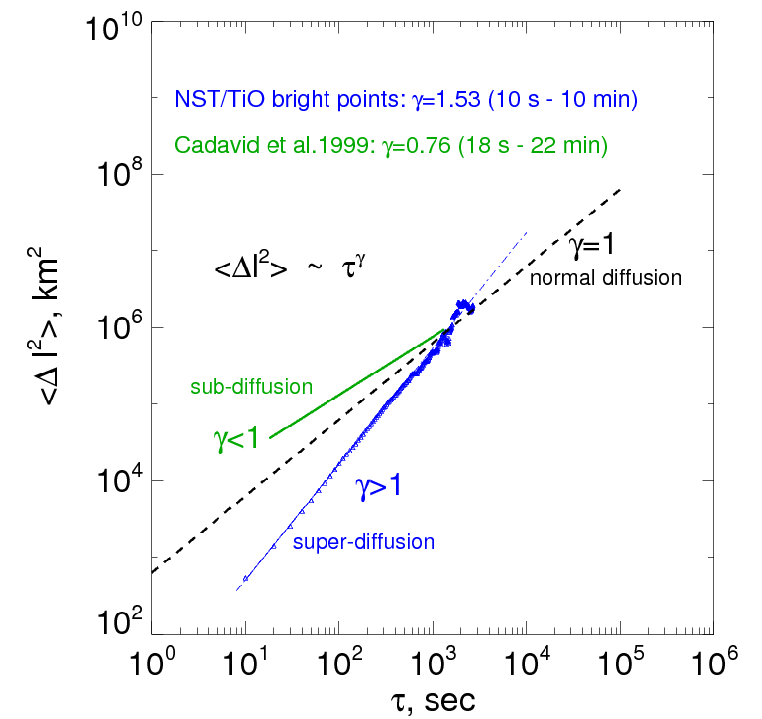 |
 |  |
These results were published in Dec 2011 issue of Astrophysical Journal (ADS | Arxiv).
| Home |
 The BBSO's New Solar Telescope enabled us to resolve previously unknown, even finer chromospheric features in blue shifted off-band H-alpha images. These absorption features, arising from the dark intergranular lanes, are short-lived, and show jet-like upflows. Their origin seems neither to be unequivocally tied to concentrations of photospheric bright points nor predominantly associated with the vertex formed by three (or more) granules. A visual inspection of NST data revealed that they frequently originate from an intergranular lane separating two granules. This is also the location where magnetic fields occur.A small coronal hole (CH) located at N03E12 was observed using the NST with adaptive optics on August 31, 2010 from 17:40 to 18:16 UT. We used this data set to search for sources of small-scale intergranular jet-like events. We thus found that intergranular events are very often associated with rapidly evolving granules, more precisely, with instances in which granule fragments are pushed into the intergranular lane. A more detailed analysis of granular evolution led us to conclude that intergranular events are most often associated with what was identified by Steiner et al. (2010) as a vortex tube. At the same time, not every vortex tube event was accompanied by a chromospheric jet.
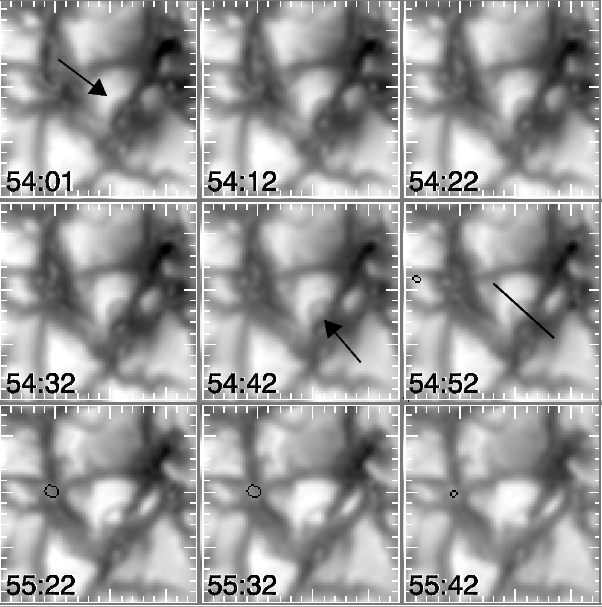
The Figure on the left shows a sequence of TiO images showing the development of a bright granular lane (BGL, arrow in 54:01 frame). The arrow in the first panel indicates a BGL, which slowly shifts toward the center of the granule as the lane evolves. The arrow in the 54:42 frame indicates a bright grain that usually accompanies the development of the BGL. The time stamp in each frame shows the minute and second of image acquisition, starting from 17:00:00~UT. Short tick marks separate 0.25~Mm spatial intervals.
At the peak of the BGL development, one or two jet-like darkenings, co-spatial with the BGL, may appear in the blue-shifted H-alpha images. These absorption features seem to originate in the intergranular lane adjacent to the bright grain.
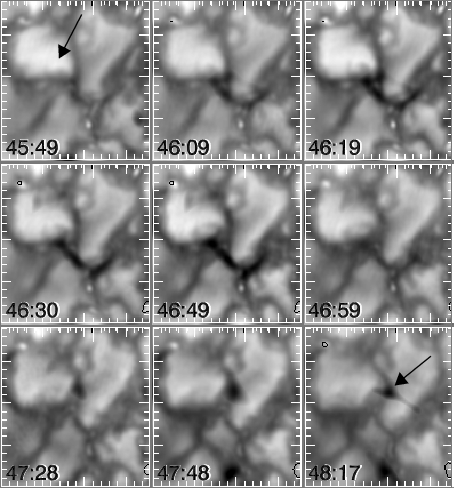
Figure on the right shows a bright granular lane (BGL) associated with chromospheric activity. This is a sequence of composite images made by combining TiO granulation data and dark Ha-0.1~nm absorption features. The arrow in the 45:49 frame points toward the BGL. The onset of chromospheric jet-like activity begins shortly after a bright grain develops (frames 46:09-46:59). The arrow in the 48:17 frame indicates an inverted "Y" jet occurring at approximately the same position as the BGL. The time stamp in each frame shows the minute and second of image acquisition starting from 17:00:00~UT. Short tick marks separate 0.25 Mm spatial intervals.
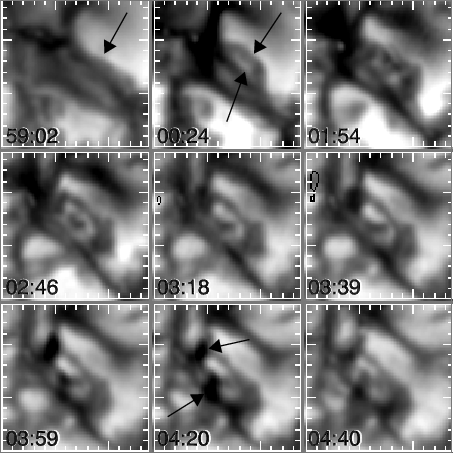
Sequence of composite images showing the development of an elongated bright granular lane (BGL). The downward pointing arrows in the 59:02 and 00:24 frames indicate the BGL, while the upward pointing arrow marks the elongated bright grain. Two small and short-lived absorption features appear on either side of the grain between 18:03:39 and 18:04:40~UT. The time stamp in each frame shows the minute and second of image acquisition starting from 17:00:00~UT. Short tick marks separate 0.25 Mm spatial intervals, and the contour shapes in frames 03:18 - 03:39 show bright Ha-0.1nm patches.
According to the simulation data, the dark space between the bright grain and the BGL coincides with the axis of the vortex tube. The interpretation is that due to low pressure and temperature, the opacity above the vortex tube is reduced thus allowing us to peer deeper into its relatively cooler interior. As it follows from simulations, the associated magnetic field, is generally wrapped up in such a way, that the field is mainly aligned with the flow, i.e., it is rather perpendicular to the vortex tube axis. The high-speed flow above the vortex tube reaches up to the top of the photosphere with velocities up to 8~km/s and sweeps the magnetic field in the horizontal direction to the intergranular lane. It may be that this field collides with the nearby intergranular field of possibly opposing polarity, which has the potential to cause some chromospheric activity.
These results have been presented in August 2011 issue of ApJ Lett. 736/2, article id. L35 (2011), ( DOI: 10.1088/2041-8205/736/2/L35), (Bibliographic Code: 2011ApJ...736L..35Y)
| Home |
 Bright points (BPs) observed in the solar photosphere are co-spatial and co-temporal with magnetic elements and they are very reliable tracers of transverse motions of photospheric magnetic flux elements. The mechanism for the formation of BPs is thought to be a convective collapse of a magnetic flux tube implying strong downflows and evacuation of the flux tube allowing us to look deeper and see hotter plasma. Analysis of statistical distributions of BPs can shed a light on the fundamental properties of smallest magnetic elements.New high resolution data from NST established that these BPs could be much smaller then previously thought: the distribution function of their size extents down to the diffraction limit of NST, i.e., photospheric bright points can be even smaller than 80 km. The image on the left is an example of NST data and it shows solar granules with chains of small bright points between them. BPs usually cluster together at special locations on the solar surface where horizontal flows converge and sink, very much reminding the flow pattern at a street water drain.
Studies of BPs size and lifetime distributions are rather scanty. Earlier studies based on data from the Hinode space observatory reported a nearly Gaussian distribution of BP's size, with the peak located near 157 km.
Observations of solar granulation were performed with the NST's 1.6 meter clear aperture using a broadband TiO filter centered at a wavelength of 705.7 nm. The observations were made with tip-tilt and adaptive optics corrections and the data were speckle reconstructed.
To detect and track BPs, scientist created a tool that allowed them to automatically detect and track BPs in the NST images.
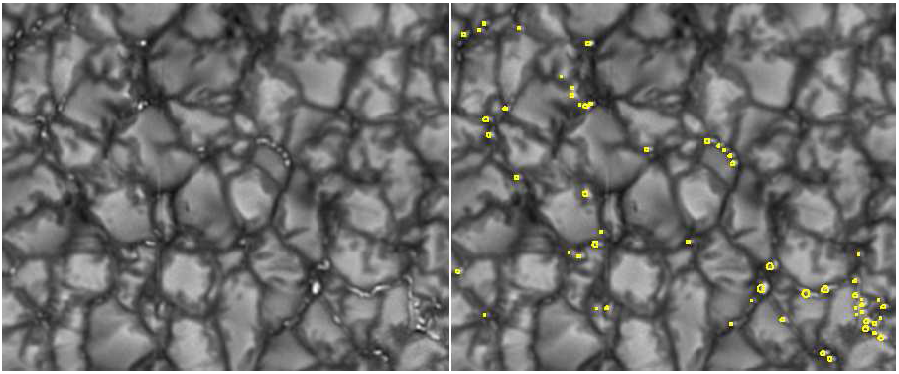 Two panels on the right show the same NST TiO image used to detect BPs with the image on the right overplotted with boundaries of detected BPs. This tool allowed scientists to measure size, lifetime, speed and the trajectory of each of BPs.
The six panel figure shows the probability distribution functions (PDFs) for
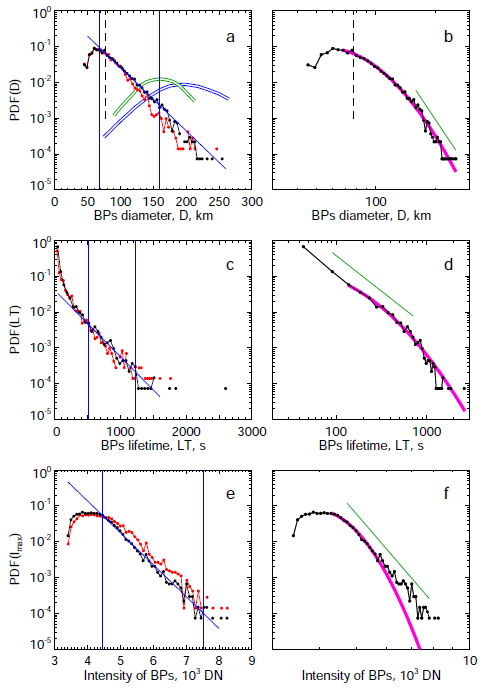 the diameter, D, lifetime, LT, and maximum intensity, Imax, of BPs. In the left panels, results for two runs are shown: the black lines correspond to the detection threshold of 85DN and the red lines to threshold of 120DN (DN - Data Numbers). The right panels show PDFs only from the threshold of 85 DN.
The difference between the two runs is small: for higher threshold the relative number of large-size events slightly decreases, and the relative number of brighter events slightly increases. The lifetime distribution does not appear to be affected by the threshold at all.
The PDF of diameters displays a nearly linear behavior in the linear-logarithmic plot (upper left). The monotonous increase is present down to the diffraction limit of NST. The saturation and the turnover of the observed PDF at scales smaller than 77km (to the left from the dashed vertical line) might be caused either by the fact than the NST does not purely resolve elements smaller than 77 km, or that elements much smaller than 77 km do not exist. For comparison, in the same panel we show the BP size distribution as derived from Hinode/SOT G-band images by Utz et al. (2009). In spite of a drastic difference in the shape of the PDFs derived from the two instruments, physically, they are consistent. The Hinode PDFs also saturate at scales corresponding to the diffraction limit of the Hinode/SOT telescope, which is 157 km for SOT observations in the G-band.
We thus conclude that the real minimal size of magnetic BPs (or magnetic flux tubes) has not yet been detected in observations with modern high resolution telescopes. As to the maximum size of BPs, the upper boundary for it seems to exist: as soon as BPs defined as those located inside intergranular lanes, the diameter of BPs cannot be larger than characteristic width of the intergranular lanes, which varies in a range of 150-400 km.
We also find that BP size distribution function has a log-normal shape. Unlike the power law, the log-normal distribution is not scale-free, therefore, there is a limit on a minimal size of an elementary flux tube, which may not have been achieved yet. The log-normal nature of the size distribution implies that the fragmentation and merging processes are important mechanisms contributing into evolution and dynamics of BPs. Frequent fragmentation and coalescence are clearly visible in the data set movie4. About 98.6% of all BPs live less than 120 s (12 time steps). This remarkable fact was not obvious from previous studies because an extremely high time cadence was required. The most important point here is that these small and short living BPs significantly increase dynamics (flux emergence, collapse into BPs, and magnetic flux recycling) of unipolar network areas. The magnetic field is thus fragmented into flux concentrations with well defined interfaces between them known as current sheets. Random motions of BPs, as well as often appearance/disappearance of new flux concentrations, will change the spatial distribution of the current sheets thus leading to release of energy.
These results have been presented in December 2010 issue of ApJ Lett., 725, L101-L105
Keine Kommentare:
Kommentar veröffentlichen